In this post, I will guide to you how to insert a chart in word? It will help to add visual detail to documents.
A chart is a graphic presentation that shows data such as numbers, used to compare, represent quantities, or find the ratio of each individual to the general.
To make your presentation or your slide show more intuitive, lively, more illustrative and professional, today this article will show you how to create a chart in Word. From here, you can more easily manipulate the document without having to create it with different application and then copy it in. Now let’s start.
How to insert a chart in word?
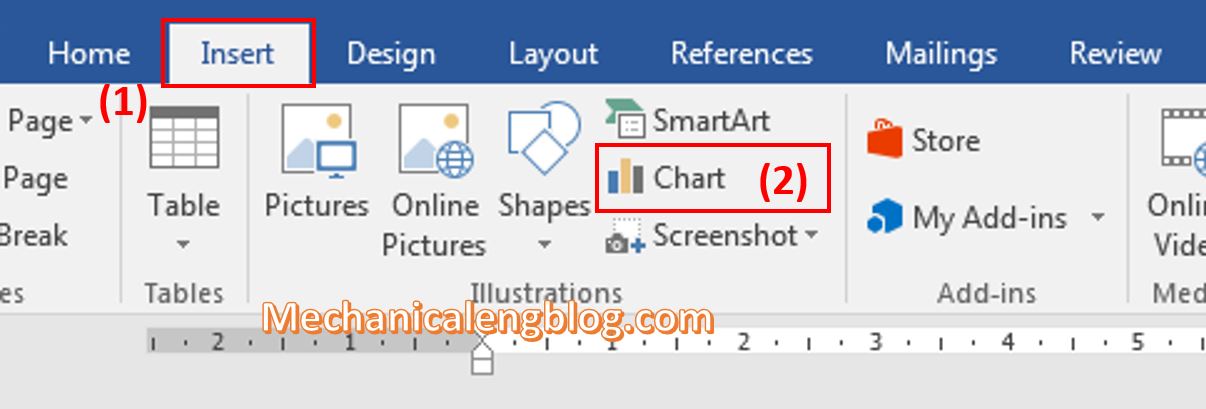
1: Go to Insert and choose Chart.
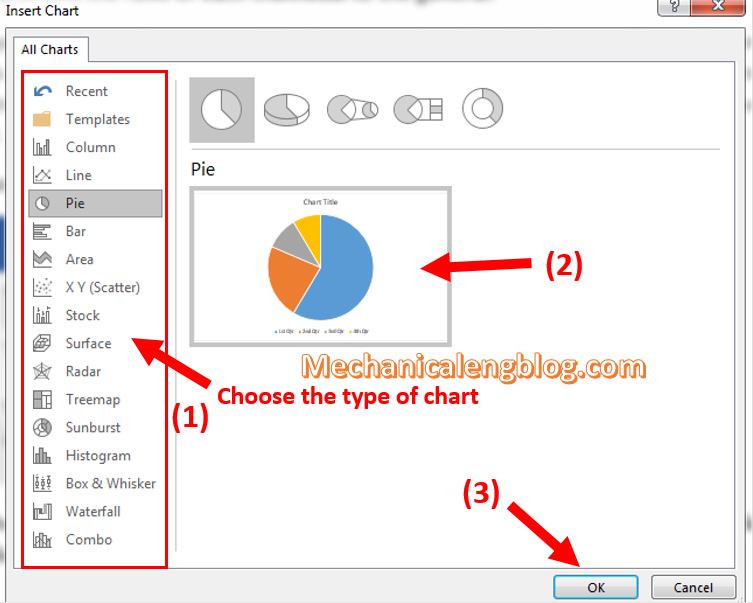
2: There are some types of chart shown at the left of the window. Choose the kind you want by double-clicking at it.
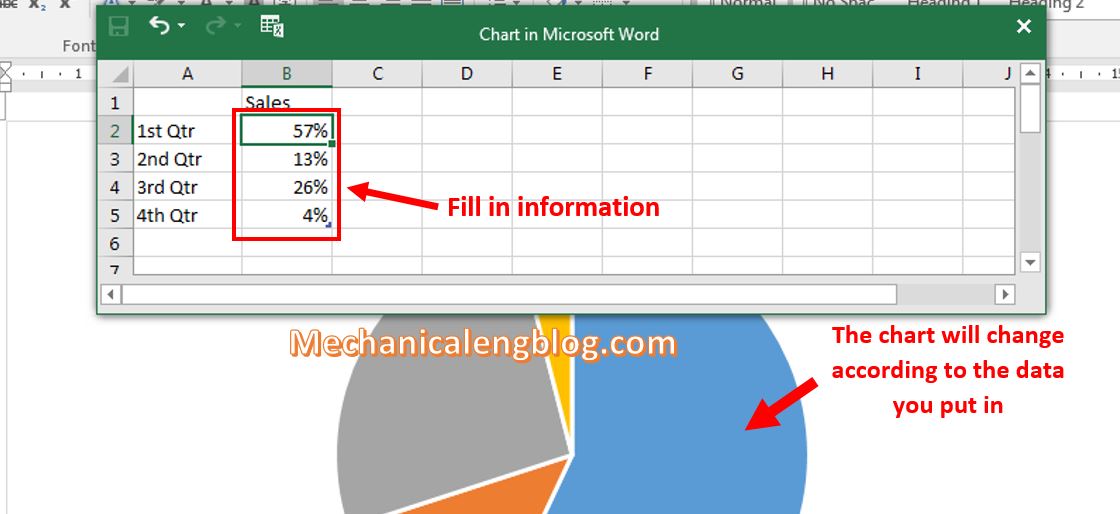
3: An Excel spreadsheet will appear with the sample form of data. From here you can enter your information value to the Excel sheet, the chart will change according.
Note: When you insert a chart, small buttons appear next to its upper-left corner.
Use the Plus button to show, hide, or format things like titles or data labels.
Use the Paint Brush button to quickly change the color or style of the chart.
The Chart Filters button is a more advanced option that shows or hides the data in your chart.

4: Close the Excel window after done filling in the data.
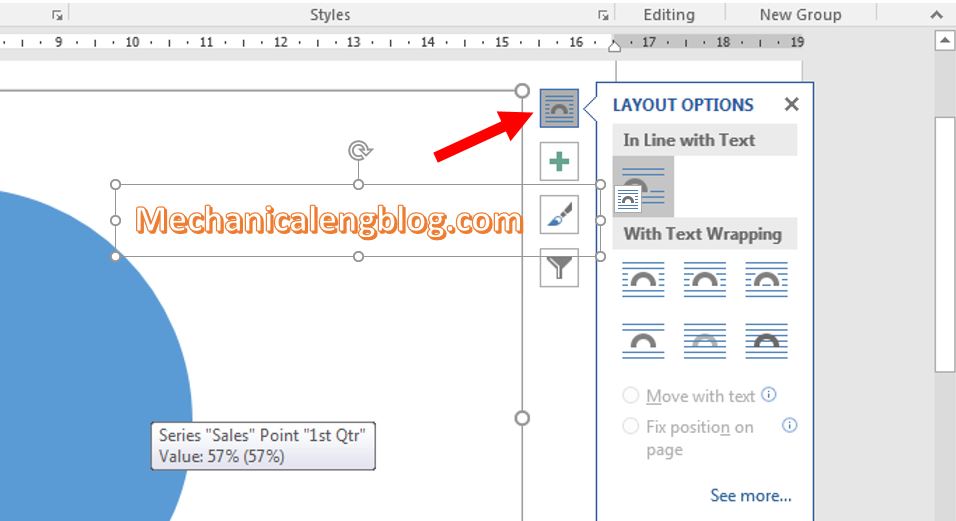
5: If you want to align the layout of the chart, choose Layout Option button as the first button from the 4 adjusting options above.
Also, the types of charts you can create are varied. And you just need to choose the template, then fill in the blanks chart boxes and you’re done.
CONCLUSION
You already know how to create a chart in Word. For other versions you can just do the same steps as above. The chart will definitely help you a lot because of its scientific, easy-to-understand. Hope you will apply these tips to your work, good luck and remember to come back for the newest useful articles. Thank you.
-hhchi


Leave a Reply